 Bordeaux
 Burgundy
 Champagne
 Rhône
Rhône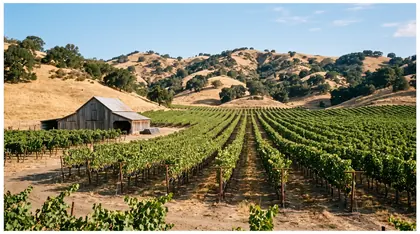 Napa Valley
 Tuscany
 Piedmont
 Mosel
Mosel Oregon
 Rioja
Rioja California sparkling
 Valais and Lavaux
 England
 Douro
Douro Etna
Etna Mendoza
 Marlborough
 Stellenbosch
 Barossa Valley
 Tasmania
 Beaujolais
 Jura
Jura Alsace
 Loire
Loire Provence
 Ribera del Duero
 Sonoma
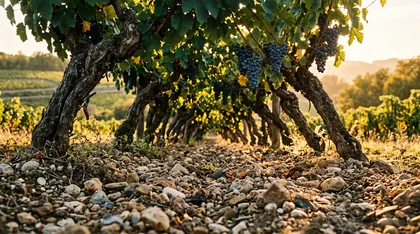 Harga lahan
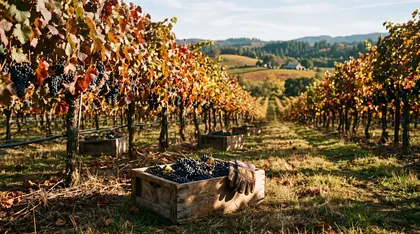 Tahun baik dan tahun buruk
 Appellation
 Kebun anggur terkenal
 Wine terkenal
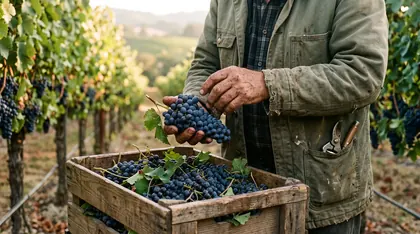 Siapa yang membuatnya
 Temukan vintage
 Bandingkan wine
Nominal and real returns
A return is how much something has gained or lost compared with what you paid. If a bottle bought for $100 sells for $150, the nominal return is $50, or 50%. Nominal means "in the dollars of the day", with no adjustment.
But a dollar today buys less than a dollar ten years ago, because of inflation: the general rise in prices over time. The real return is what is left after allowing for inflation. If prices in general rose 30% over the same period, that 50% nominal gain is a much smaller real gain, because the $150 buys less than it used to.
Compound annual growth rate (CAGR)
Comparing a gain over ten years with a gain over three years is confusing. So economists convert returns into a yearly rate. The compound annual growth rate, or CAGR, is the steady yearly growth that would turn the starting value into the ending value.
Compound means each year's growth is added on top of the previous years' growth, like interest earning interest. That is why doubling in ten years is not 10% a year: 10% a year for ten years would turn $100 into about $259. The true rate for doubling in ten years is only about 7.2% a year.
The formula is: CAGR = (ending value ÷ starting value), raised to the power of (1 ÷ number of years), minus 1. For $100 growing to $200 over 10 years: 2 to the power of 0.1 is about 1.072, so the CAGR is about 7.2%.
Try it: using the formula, what is the CAGR if $100 grows to $400 in 20 years? (Hint: it is the same as doubling every 10 years.)
Costs that eat into returns
Price indices and headlines usually show how market prices moved, not what an owner actually kept. The earlier chapters met the costs that sit between the two: buyer's premium or merchant margin when buying, storage and insurance every year, and seller's commission when selling. On top of that comes the interest the money could have earned elsewhere.
Then there is tax. In the United States, wine counts as a collectible for tax purposes, and long-term gains on collectibles can be taxed at a maximum federal rate of 28%, higher than the top rate on most shares (see IRS Topic 409). Other countries have different rules, and tax is a subject where people need proper professional advice for their own situation.
Indices, volatility and drawdown
To follow the market as a whole, people use an index: a single number that tracks the prices of a basket of items. The Liv-ex Fine Wine 100, which tracks the prices of 100 widely traded fine wines, is one of the best known.
Indices let us measure risk. Volatility is how much prices jump around; a calm market has low volatility. Drawdown is the fall from a peak to a later low. If an index rises from 100 to 130 and then falls back to 100, the drawdown is 30 ÷ 130, about 23%, even though it ends where it began.
Fine wine has had big swings. Prices boomed and then fell sharply around 2011, driven partly by demand from China for top Bordeaux that cooled quickly. Prices rose strongly again in 2021 and 2022 and then fell back through 2023 and 2024. Anyone who bought near a peak had to wait a long time, or sell at a loss.

Comparing like with like
A return only means something when it is compared with an alternative. The simplest comparison is with money left in a safe savings account, which earns interest: a payment for letting a bank use your money. If wine earned 2% a year after costs while a savings account paid 4%, the wine did worse, even though its price went up.
Wine also has a feature that surprises many people: it pays no income. A savings account pays interest and a share in a company may pay a dividend, but a bottle in a warehouse pays nothing while you hold it. Its only possible reward is a rise in price, which may or may not happen, set against costs that arrive every year whatever happens.
Finally, any fair comparison has to include risk, meaning the chance that the result is worse than expected. In economics, higher possible rewards almost always come with higher risk. A wine whose price can fall by a third in a bad year is far riskier than a bank deposit, and a sensible comparison never ignores that difference.
This chapter is about how to measure, not about what anyone should do. Researchers measure returns to understand markets. Deciding what to do with real money is a personal matter that depends on each person's situation, and it is where qualified, independent advice belongs.
Survivorship bias, and what the past cannot tell you
Survivorship bias is the mistake of judging something only by the examples that are still around. Wine price studies often focus on the famous names that did well, because those are the wines still traded. Wines that faded, spoiled or simply lost fashion drop out of the data, so the average looks better than the real experience of buyers.
Most important of all, past performance does not predict future results. A wine that rose last decade may fall this decade. Tastes change, new buyers come and go, and bottles age past their best. Honest measurement is a tool for understanding what happened, not a promise about what will.
Think about it: if you only studied pop stars who are famous today, what would you wrongly conclude about how easy it is to become famous?
Worked example: from headline gain to honest return
Here is a made-up bottle with round numbers. It costs $100 all in, is held for 10 years and sells at a hammer price of $200. For simplicity, storage and insurance paid along the way are subtracted at the end.
| Cost, including buying fees | $100 |
|---|---|
| Hammer price after 10 years | $200 |
| Headline CAGR ($100 to $200 in 10 years) | about 7.2% a year |
| Seller's commission (10% of $200) | minus $20 |
| Storage and insurance (10 years × $3) | minus $30 |
| Money actually kept | $150 |
| CAGR after costs ($100 to $150 in 10 years) | about 4.1% a year |
| Real CAGR after made-up inflation of 2.5% a year | about 1.6% a year (1.041 ÷ 1.025, minus 1) |
The headline says 7.2% a year. After fees and storage it is about 4.1%, and after inflation about 1.6%, before any tax on the $50 gain. And this bottle doubled; many do not, and some lose value.
Key words
- Nominal return
- A gain or loss measured in the money of the day, with no adjustment for inflation.
- Inflation
- The general rise in prices over time, which means each dollar buys a little less.
- Real return
- A return after allowing for inflation, showing the change in what your money can actually buy.
- CAGR
- Compound annual growth rate: the steady yearly rate that turns a starting value into an ending value.
- Indeks
- A single number that tracks the prices of a basket of items, such as the Liv-ex Fine Wine 100.
- Volatilitas
- How much and how quickly prices move up and down.
- Drawdown
- The fall from a peak price to a later low, shown as a percentage of the peak.
- Survivorship bias
- Drawing conclusions only from the examples that survived, ignoring the ones that failed or disappeared.
Check your understanding
Why is doubling in 10 years not the same as 10% a year?
Show the answer
Because growth compounds. 10% a year for 10 years turns $100 into about $259, while doubling needs only about 7.2% a year.
An index rises from 200 to 250 and then falls to 150. What is the drawdown?
Show the answer
The fall from the peak is 250 minus 150 = 100, and 100 ÷ 250 = 40%.
Name three costs that make an owner's return lower than the change in market price.
Show the answer
Any three of: buyer's premium or merchant margin, storage, insurance, seller's commission, tax, and the interest the money could have earned elsewhere.
What is survivorship bias, and how can it flatter wine returns?
Show the answer
It means looking only at the examples that survived. Studies that track only famous wines still traded today leave out wines that faded or lost value, so average returns look better than buyers really experienced.
Go deeper on Corkonomics
Sources and further reading
- Fine wine market data and indices Liv-ex
- Capital gains and losses (Topic 409) US Internal Revenue Service
- Journal of Wine Economics Cambridge University Press / American Association of Wine Economists
Research and education only. Nothing here is investment advice.
Next chapterBuilding a collection sensibly← Previous chapterAll chapters