 Bordeaux
 Burgundy
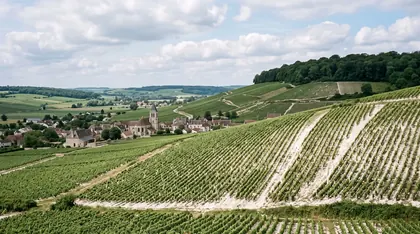 Champagne
 Rhône
Rhône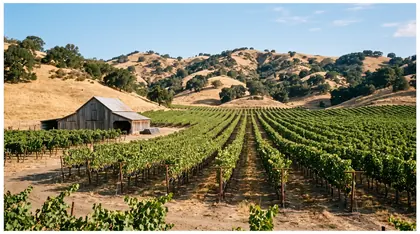 Napa Valley
 Tuscany
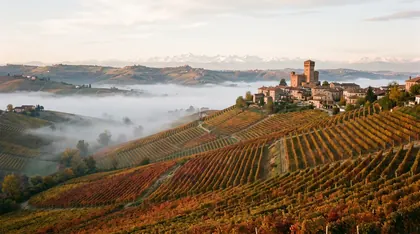 Piedmont
 Mosel
Mosel Oregon
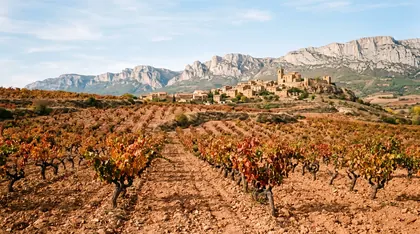 Rioja
Rioja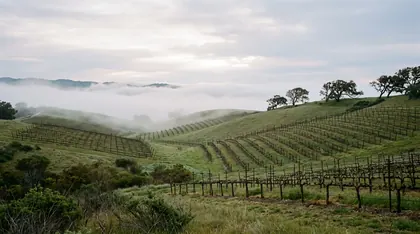 California sparkling
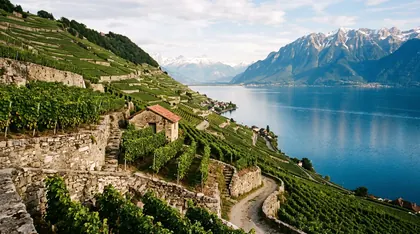 Valais and Lavaux
 England
 Douro
Douro Etna
Etna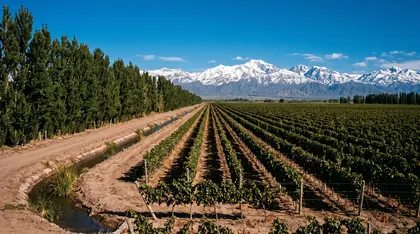 Mendoza
 Marlborough
 Stellenbosch
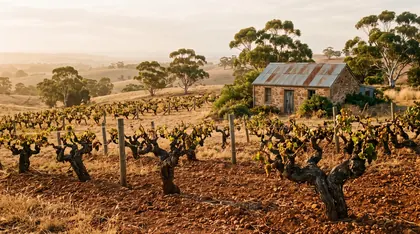 Barossa Valley
 Tasmania
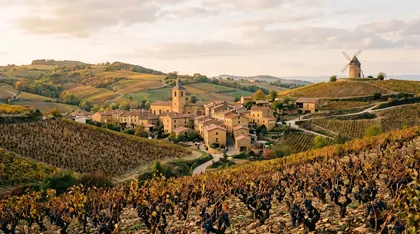 Beaujolais
 Jura
Jura Alsace
 Loire
Loire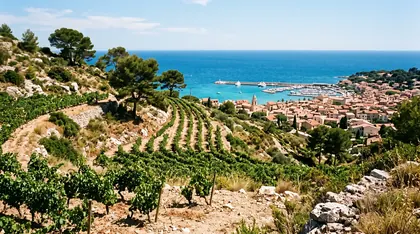 Provence
 Ribera del Duero
 Sonoma
 What land costs
 Good years and bad
 Appellations
 Famous vineyards
 Famous wines
 Who makes them
 Find a vintage
 Compare wines
Basis labels
A named source published the figure: a producer’s website or technical sheet, a government agency, a trade body, a filing, or reporting by a named publication. The source and its date are recorded.
Inferred from evidence with a stated method (for example a production figure derived from vineyard area and typical yield, or a release price worked back from a percentage change a publication reported).
The output of a Corkonomics model with published inputs: the production-cost estimate and the scarcity score.
Arithmetic on rows shown on the same page: a percentage change, a multiple, a growth rate.
An assessment written by editors — the rating of a vintage year, a wine’s place in the collectors’ market — and labelled as opinion.
What the site does not hold
Corkonomics holds no valuation of any wine and no price index. What it holds are published prices, each with its source: release prices and first US retail offers as reported by named publications (basis Reported), and auction lots from the results pages of Christie’s, Hart Davis Hart and Sotheby’s (basis Observed), shown in the currency of the sale as the house published them and never converted, averaged or compounded into a return. Christie’s and Sotheby’s publish the price realised, which is the hammer price plus the buyer’s premium; Hart Davis Hart lists the hammer price before the premium. A per-bottle figure is only the lot price divided by the bottles in the lot. Lots that mix wines or vintages, or whose format the listing does not state, are left out rather than guessed. Merchant asking-price feeds and indices live in licensed databases (Liv-ex, Wine-Searcher) the site has not licensed; rather than fill that gap with synthetic figures, the site shows nothing in its place.
Release prices
A release price is the producer’s opening price when a vintage is first offered — for Bordeaux, the ex-négociant en primeur price to the trade. Corkonomics records one only when a named publication reported it, with the publication linked on the vintage page, in the currency of release and never converted. Where a publication reported a percentage change rather than a price, the implied price is recorded as Estimated with the arithmetic in the note.
Vintage ratings
Each covered year in each region carries an editorial rating of the growing season and the wines it produced, on a six-step scale: exceptional, excellent, very good, good, mixed, difficult. It describes the regional year, not any single estate, which can beat or miss it. It is opinion, labelled as such, and says nothing about price.
Scarcity score
A number from 0 to 100 estimating how hard a wine-vintage is to find. It starts from the bottles made (reported where the producer publishes it, otherwise estimated from vineyard area and typical yield), assumes about 3% of the surviving bottles are drunk each year for the first fifteen years and fewer after, and adjusts for bottle size and the producer’s market standing. 100 means very few bottles are likely left; a blank means no production figure is published, and the site does not guess one. It is not a rating of quality and not a valuation.
Production-cost model
An itemised estimate of what a winery spends to make one 75 cl bottle of a given style, in US dollars, as a low-to-high range. Land is charged as the opportunity cost of capital — the vineyard’s value times an interest rate, divided by the bottles a hectare yields — never as a purchase price. Farming and harvest costs per hectare are divided by bottles per hectare. Barrels are amortised over their uses and weighted by the share of new oak. Aging carries a cellar cost per year and financing on the cash already spent. Bottle, closure, label, case, bottling and overhead are per-bottle inputs. Every input is sourced on the model page and can be changed in the calculator.
Official statistics
The winery producer price index, the wine-grape producer price index, the average retail price of table wine, the consumer price index and the Treasury-bill rate are from the US Bureau of Labor Statistics and the Federal Reserve via FRED; the S&P 500 and gold from Financial Modeling Prep; US imports of wine by origin from the U.S. Census Bureau; tariff lines from the USITC. Each chart states its unit, period and source on the chart. A producer price index has no unit: it is set to 100 in a base period and 200 means prices have doubled since then.
The arithmetic used on the site
cagr
Compound annual growth rate: (end/start)^(1/years) - 1. Requires at least a year between the two points; shorter spans are reported as a simple return instead so a two-month move is never annualised into nonsense.
drawdown
Largest peak-to-trough decline in a dated series of (date, value). Returned as a negative fraction (-0.32 = a 32% fall from the prior peak).
volatility
Annualised standard deviation of log returns between consecutive observations, scaled by the average spacing. Needs enough observations to mean anything; returns None below `min_points`.
scarcity score
0–100. Method: start from estimated production (fewer bottles = scarcer), reduce the surviving supply by an age-based consumption curve (about 3% a year for the first 15 years, slowing after, unless a surviving fraction is supplied), then adjust for how often the wine is seen at auction (rarely seen = scarcer) and for bottle size (large formats are rarer). Producer prestige tier shifts the curve because a scarce wine nobody wants is not 'scarce' in the market sense. production 600,000 bottles and young → ~15; 5,000 bottles, 20 years old, rarely traded → ~95.
cost model
Estimated winery production cost per 750 ml bottle, as a range. params: dict of inputs, each {low, high, unit, basis, source}. Keys: land_value_per_ha, cost_of_capital, yield_hl_ha, grape_price_per_kg (or None), farming_cost_per_ha, harvest_cost_per_ha, barrel_price, new_oak_share, barrel_uses, litres_per_barrel, aging_years, cellar_cost_per_bottle_year, winemaking_labour_per_bottle, bottle_cork_label, packaging, bottling, overhead_per_bottle, losses_share, financing_rate Method: land is treated as an IMPUTED cost — the opportunity cost of capital tied up in the vineyard (value × rate), never a purchase price. Vineyard operations per hectare are divided by bottles per hectare (yield in hl/ha × 100 / 0.75 × (1 − losses)). Where a grape price exists, it replaces land + farming for a purchased-fruit winery and both routes are shown. Barrels are amortised over their uses. Aging carries an annual cellar cost and financing on the cash already spent. Returns {components: [(name, low, high)], total_low, total_high, bottles_per_ha}.
net of costs
Turn a gross price change into an all-in figure: the buyer's premium paid on the way in, the seller's commission on the way out, and annual storage and insurance as a share of value. Illustrative defaults; the page states them beside the result.
Indexing gate and thin pages
A page is offered to search engines only when it carries substance: a summary, a body of at least 160 words, at least three structured facts and two graph relations for entities; a summary, a body and at least three vintage records for wines; and for a vintage page at least one dated record — a reported release price, a production figure or a sourced vintage note. Pages below the threshold still exist for readers but carry a noindex tag and are absent from the sitemap. The same function decides all three, so they cannot disagree.
Data quality rules
- A vintage year cannot exceed the current year.
- A price must carry a currency and a named source; the seed and the CMS refuse rows without a basis, and the database refuses any observation whose basis is not observed, reported or estimated.
- Estimated and modeled values must be labelled.
- Factual claims require a source; records without one are queued for editors and cannot be indexed.
- Duplicate wines and producer aliases are reconciled by canonical slug and alias lists.
- Release dates are recorded only when a publication reported one; none is inferred from the vintage year.
What is not modelled
Transaction costs, storage, insurance, spreads, provenance, condition, authenticity and breakage — all of which reduce real-world returns. The official statistics page shows an illustrative net-of-costs figure on round numbers with its assumptions stated, and the Learn page lets you set your own.