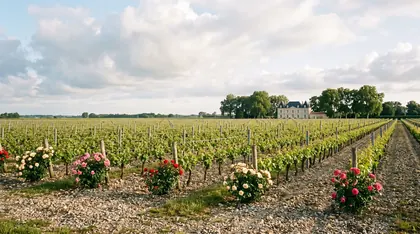
 Bordeaux
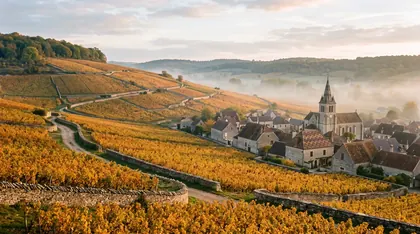 Burgundy
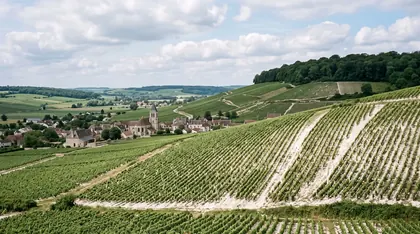 Champagne
 Rhône
Rhône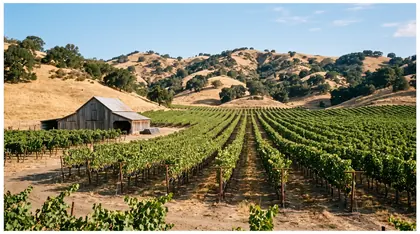 Napa Valley
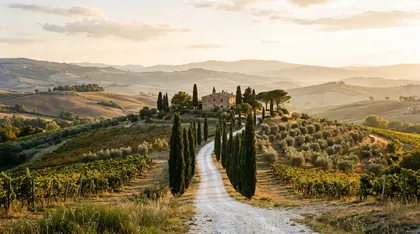 Tuscany
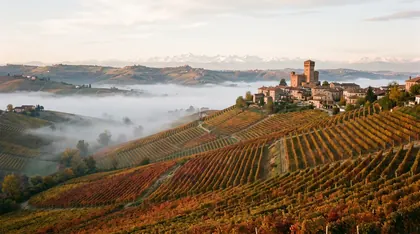 Piedmont
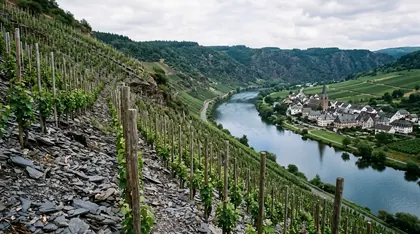 Mosel
Mosel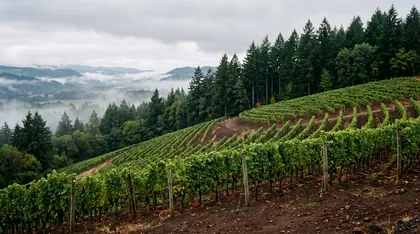 Oregon
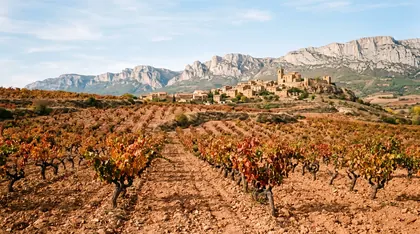 Rioja
Rioja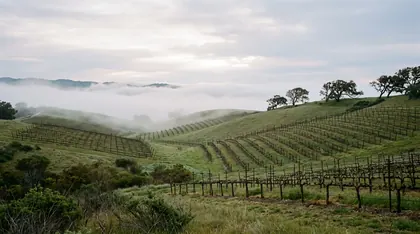 California sparkling
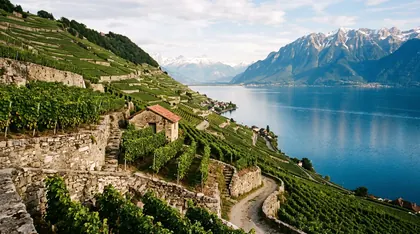 Valais and Lavaux
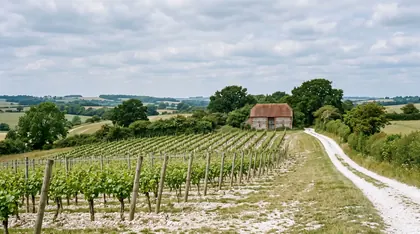 England
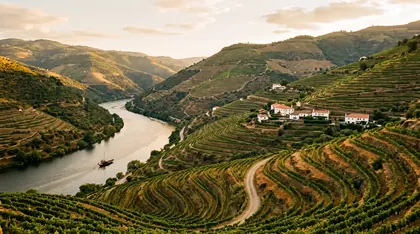 Douro
Douro Etna
Etna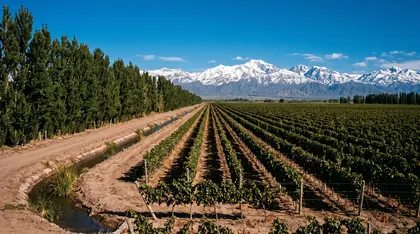 Mendoza
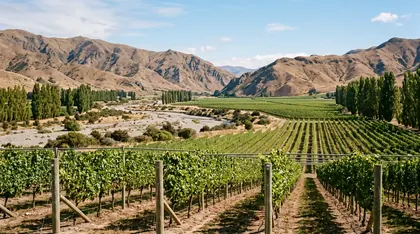 Marlborough
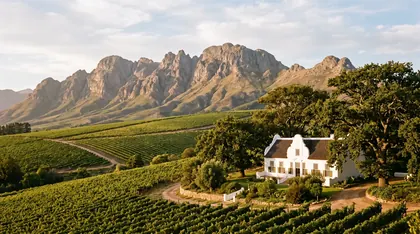 Stellenbosch
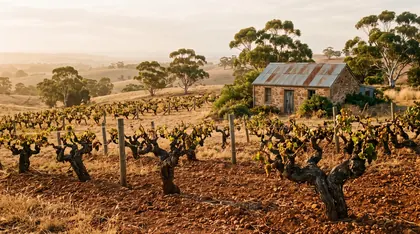 Barossa Valley
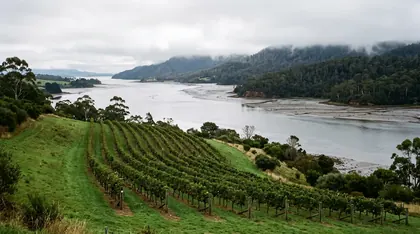 Tasmania
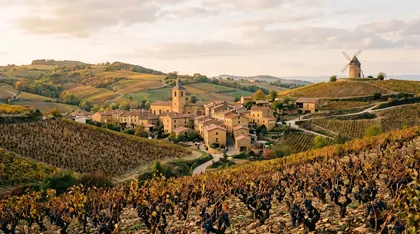 Beaujolais
 Jura
Jura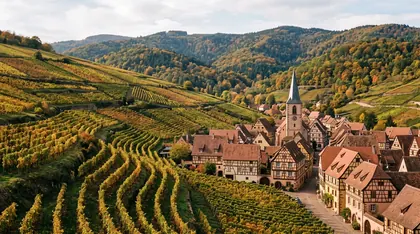 Alsace
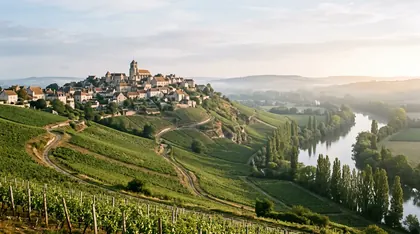 Loire
Loire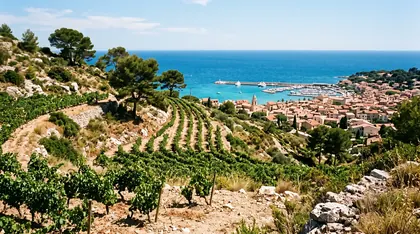 Provence
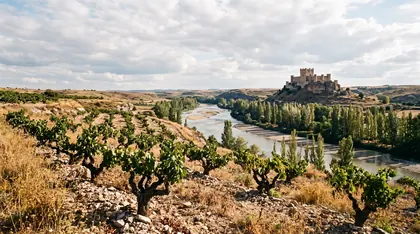 Ribera del Duero
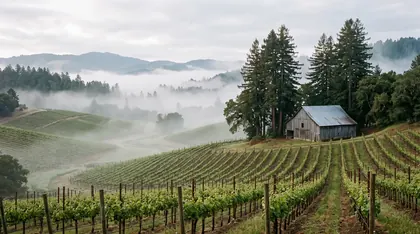 Sonoma
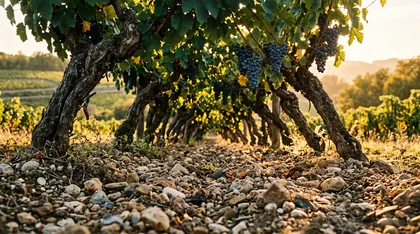 What land costs
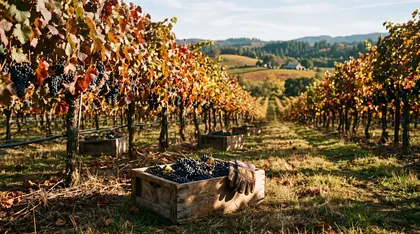 Good years and bad
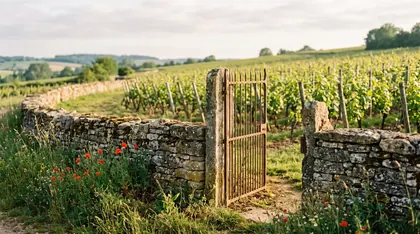 Appellations
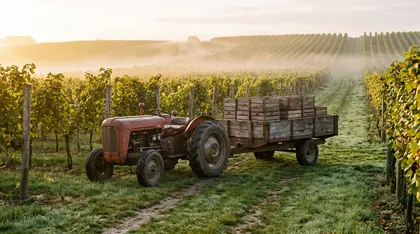 Famous vineyards
 Famous wines
 Who makes them
 Find a vintage
 Compare wines
ExceptionalExcellentVery goodGoodMixedDifficult
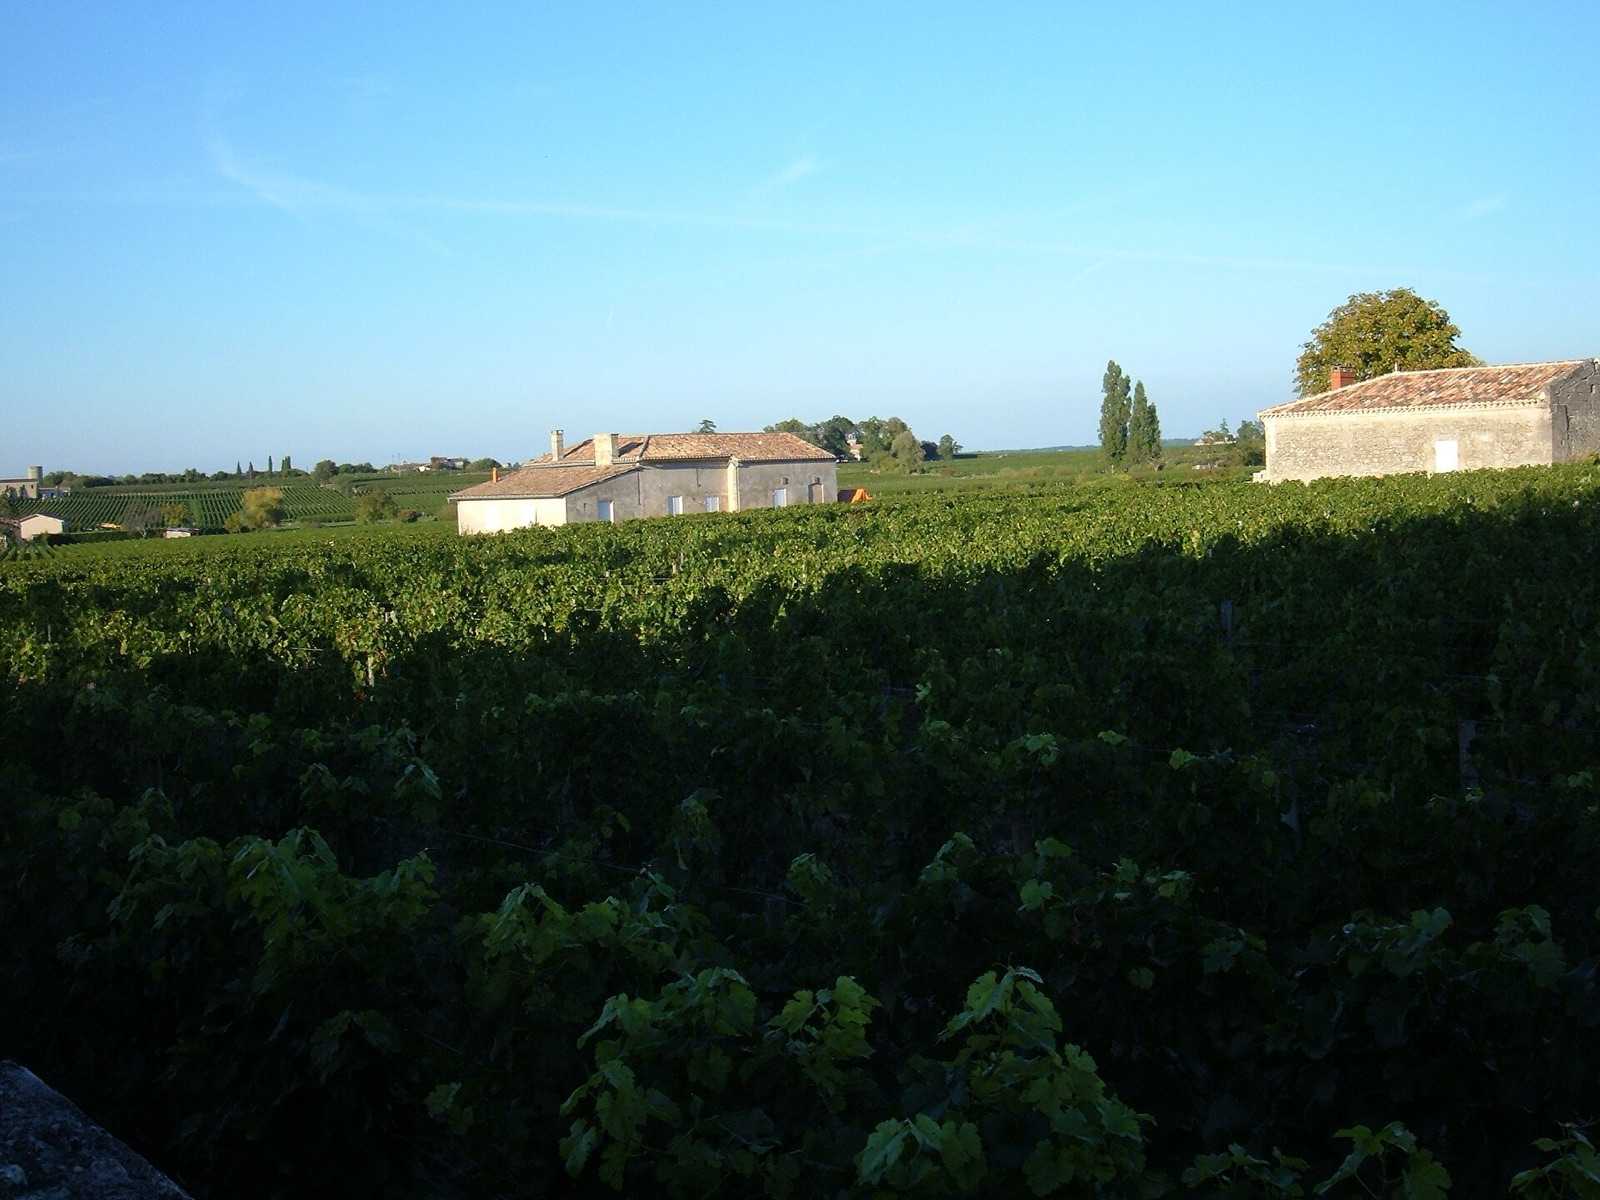
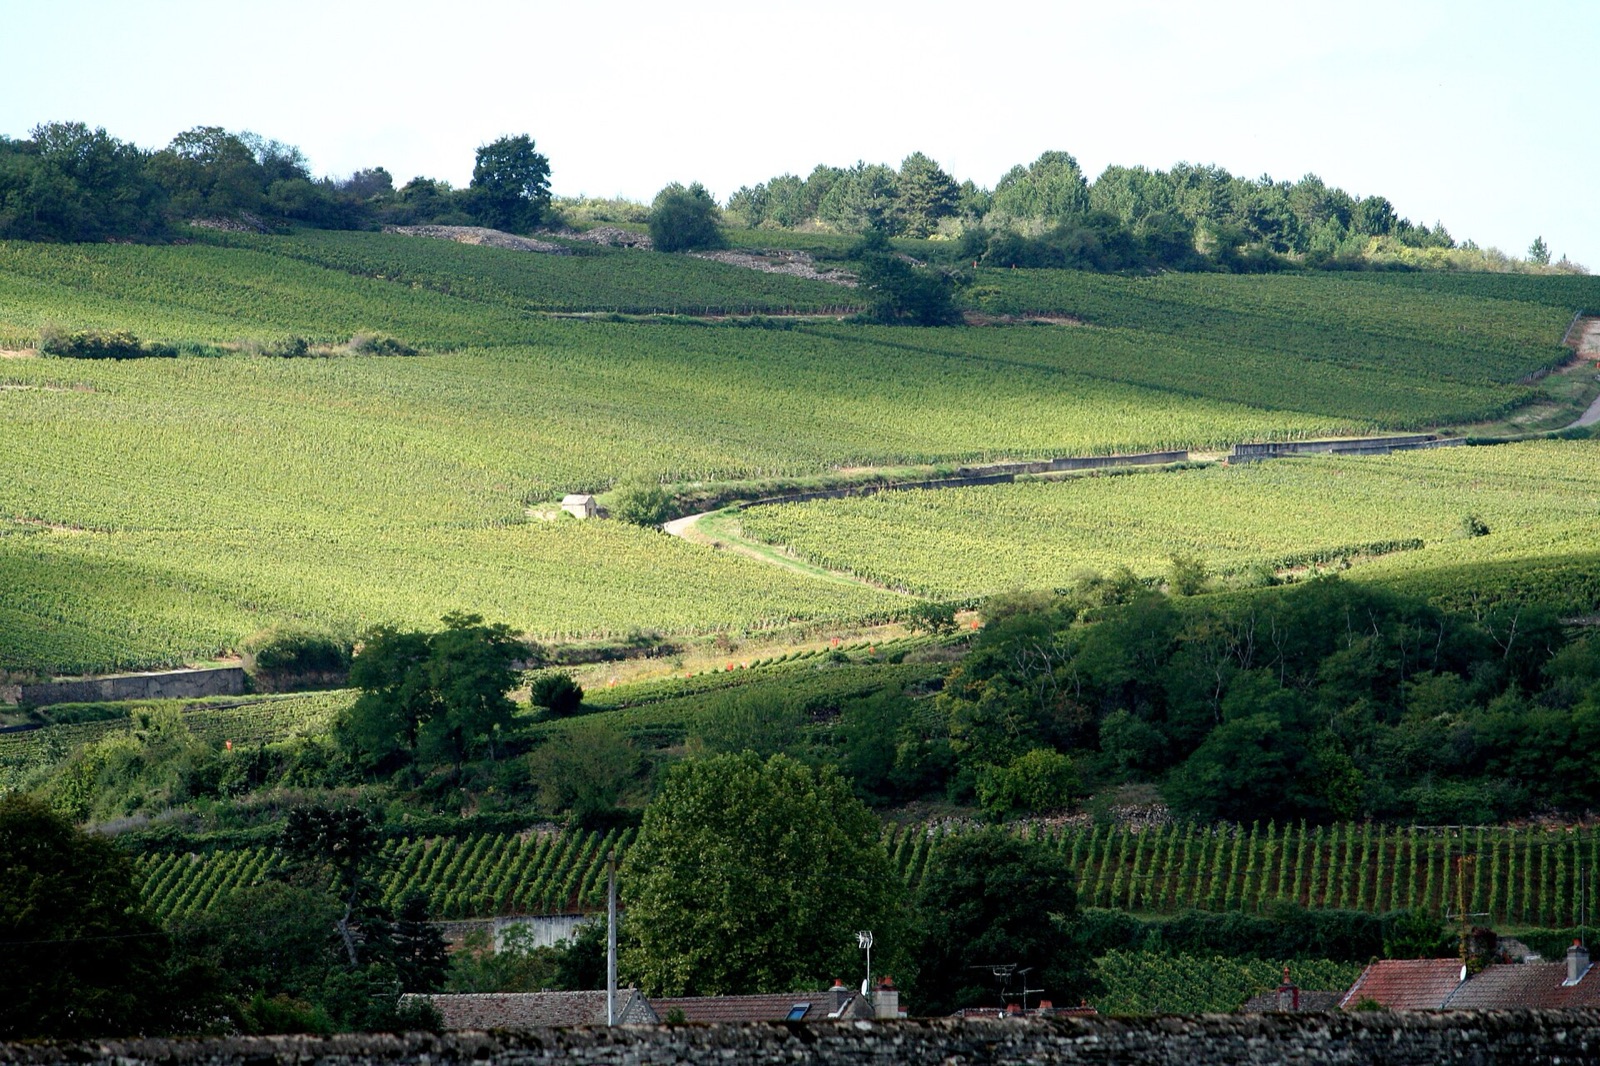
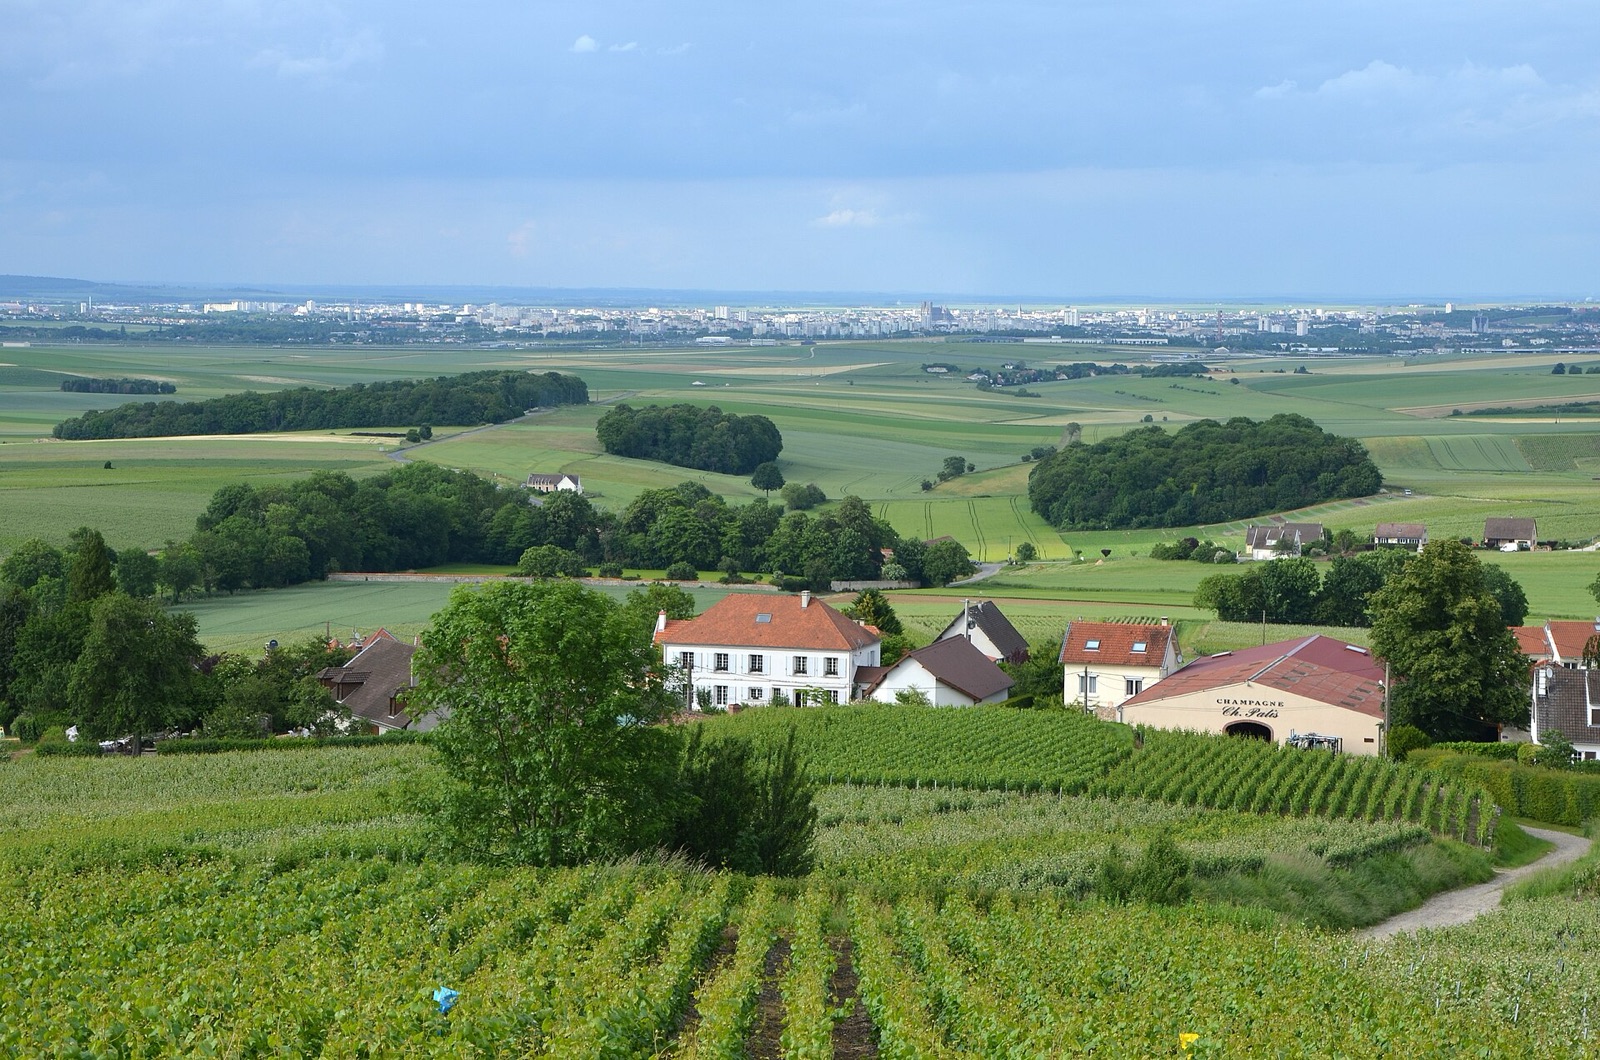
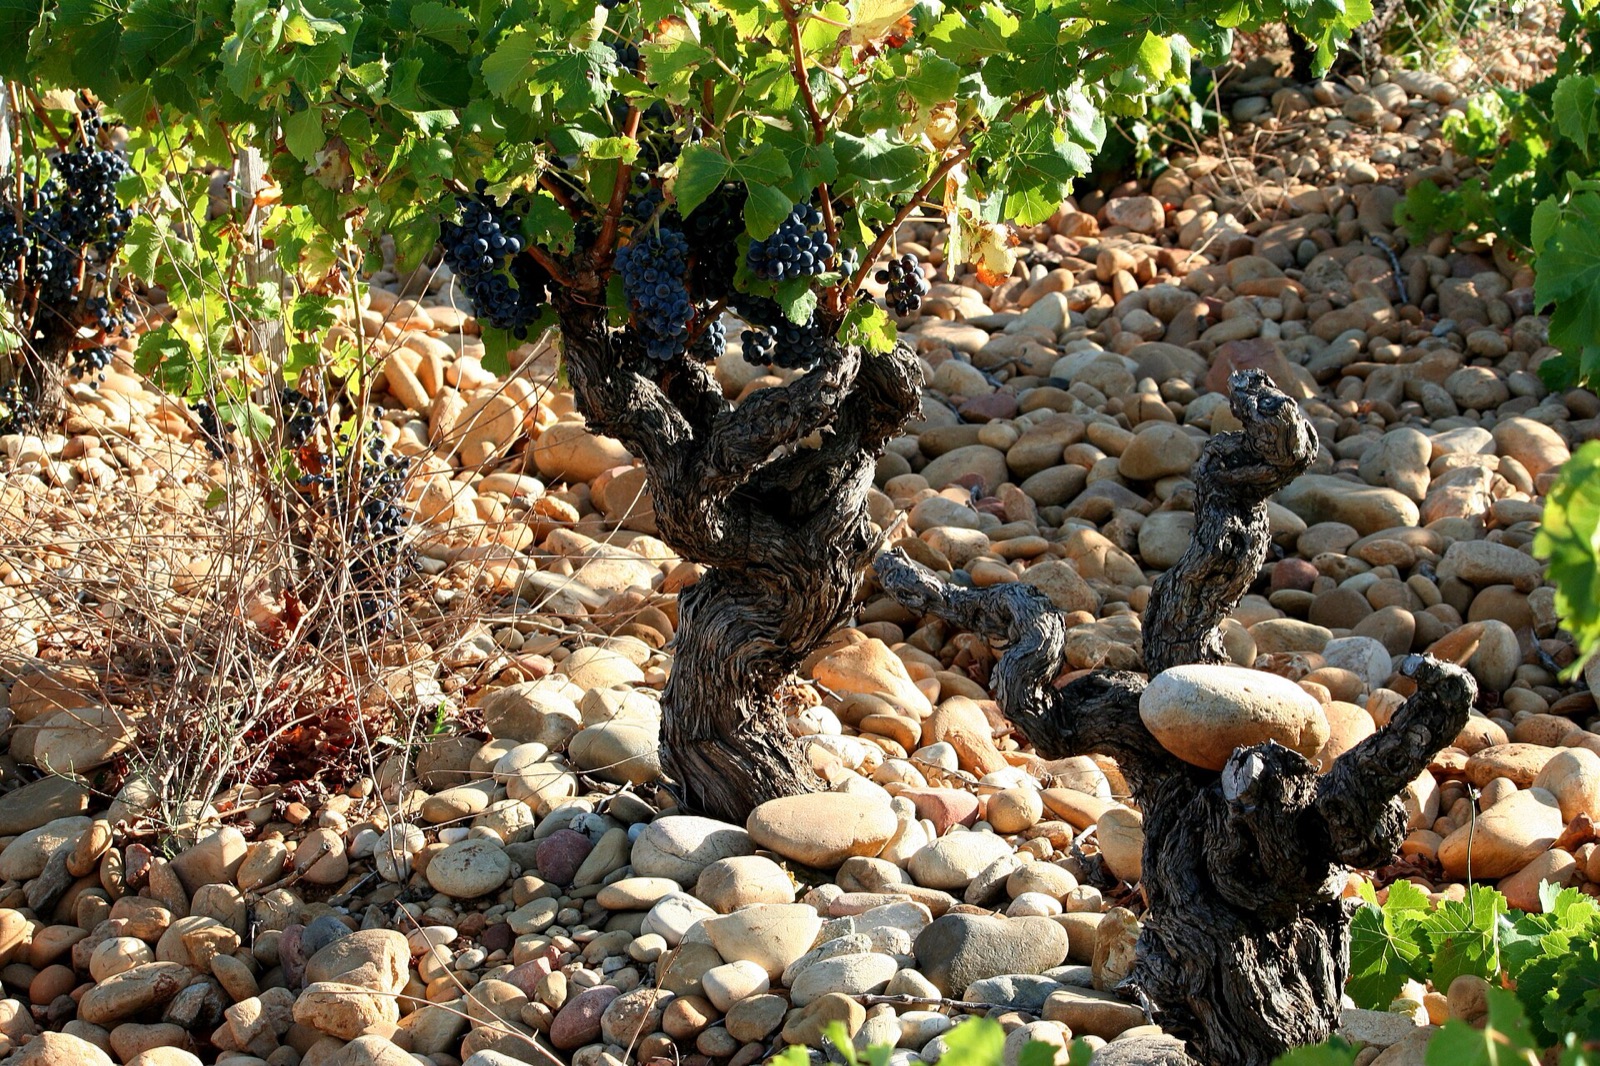
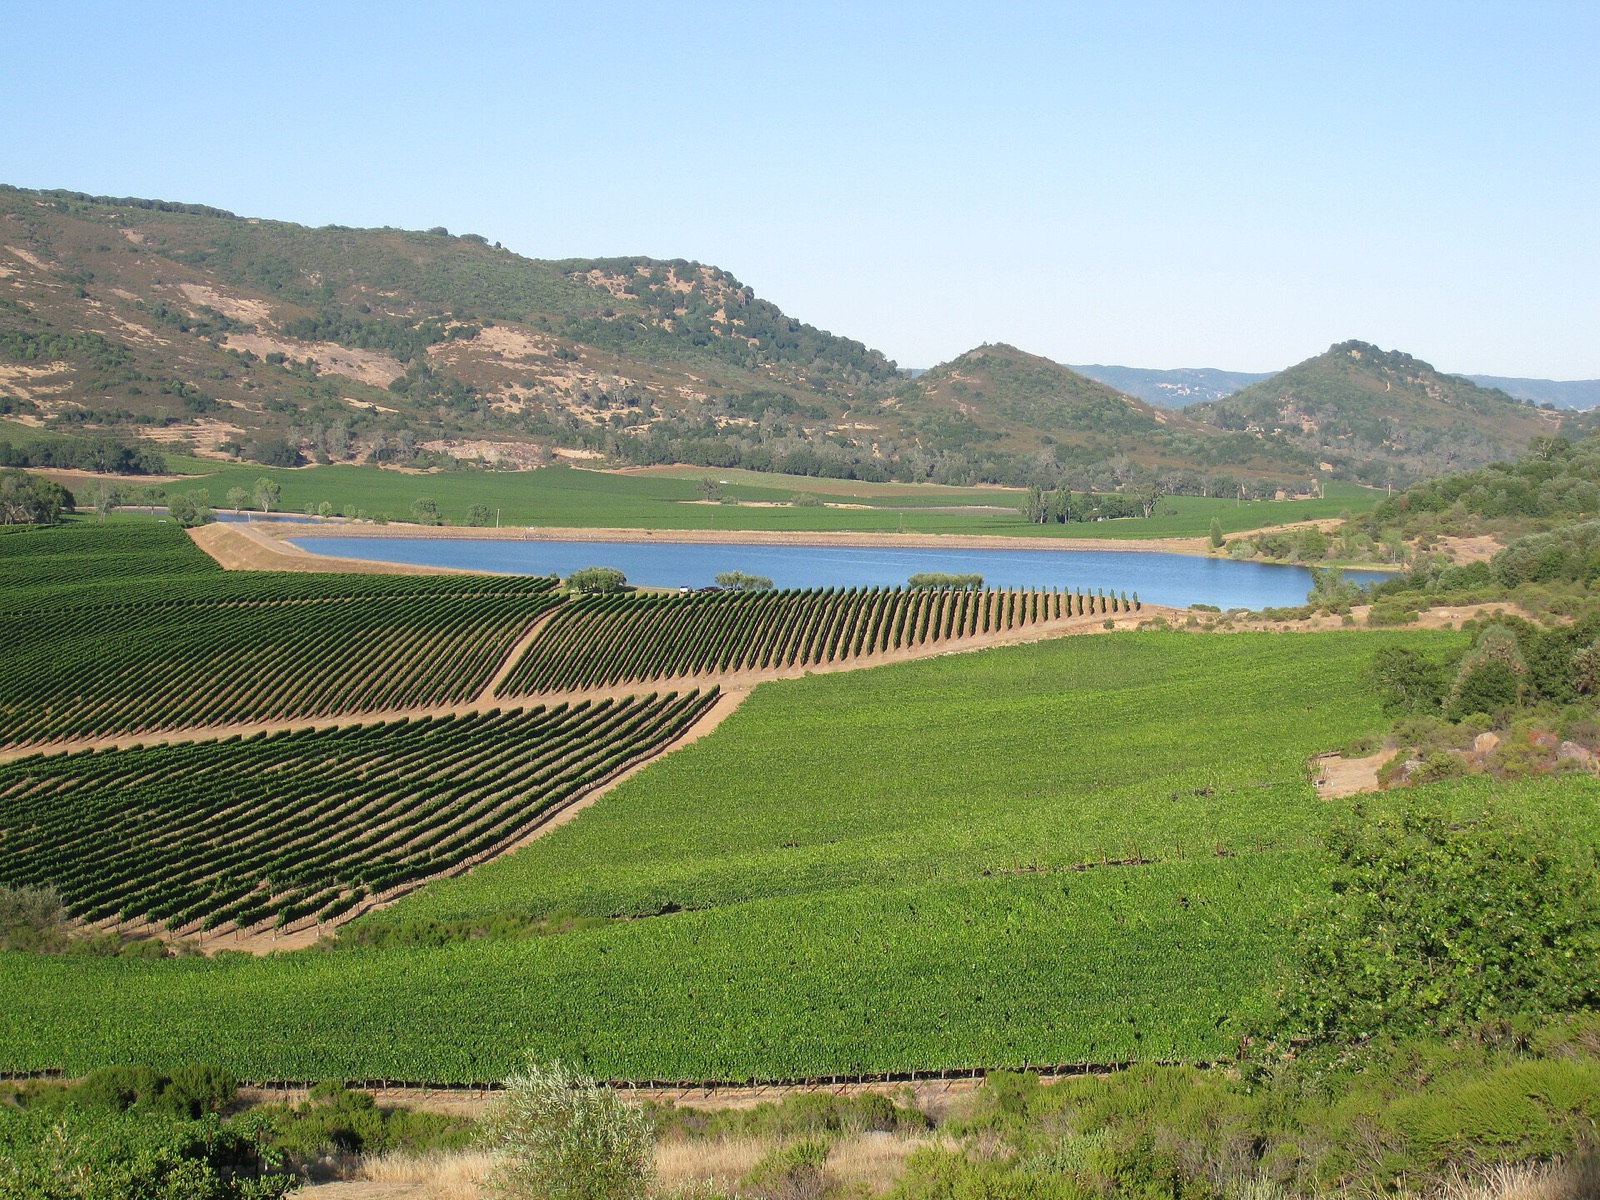
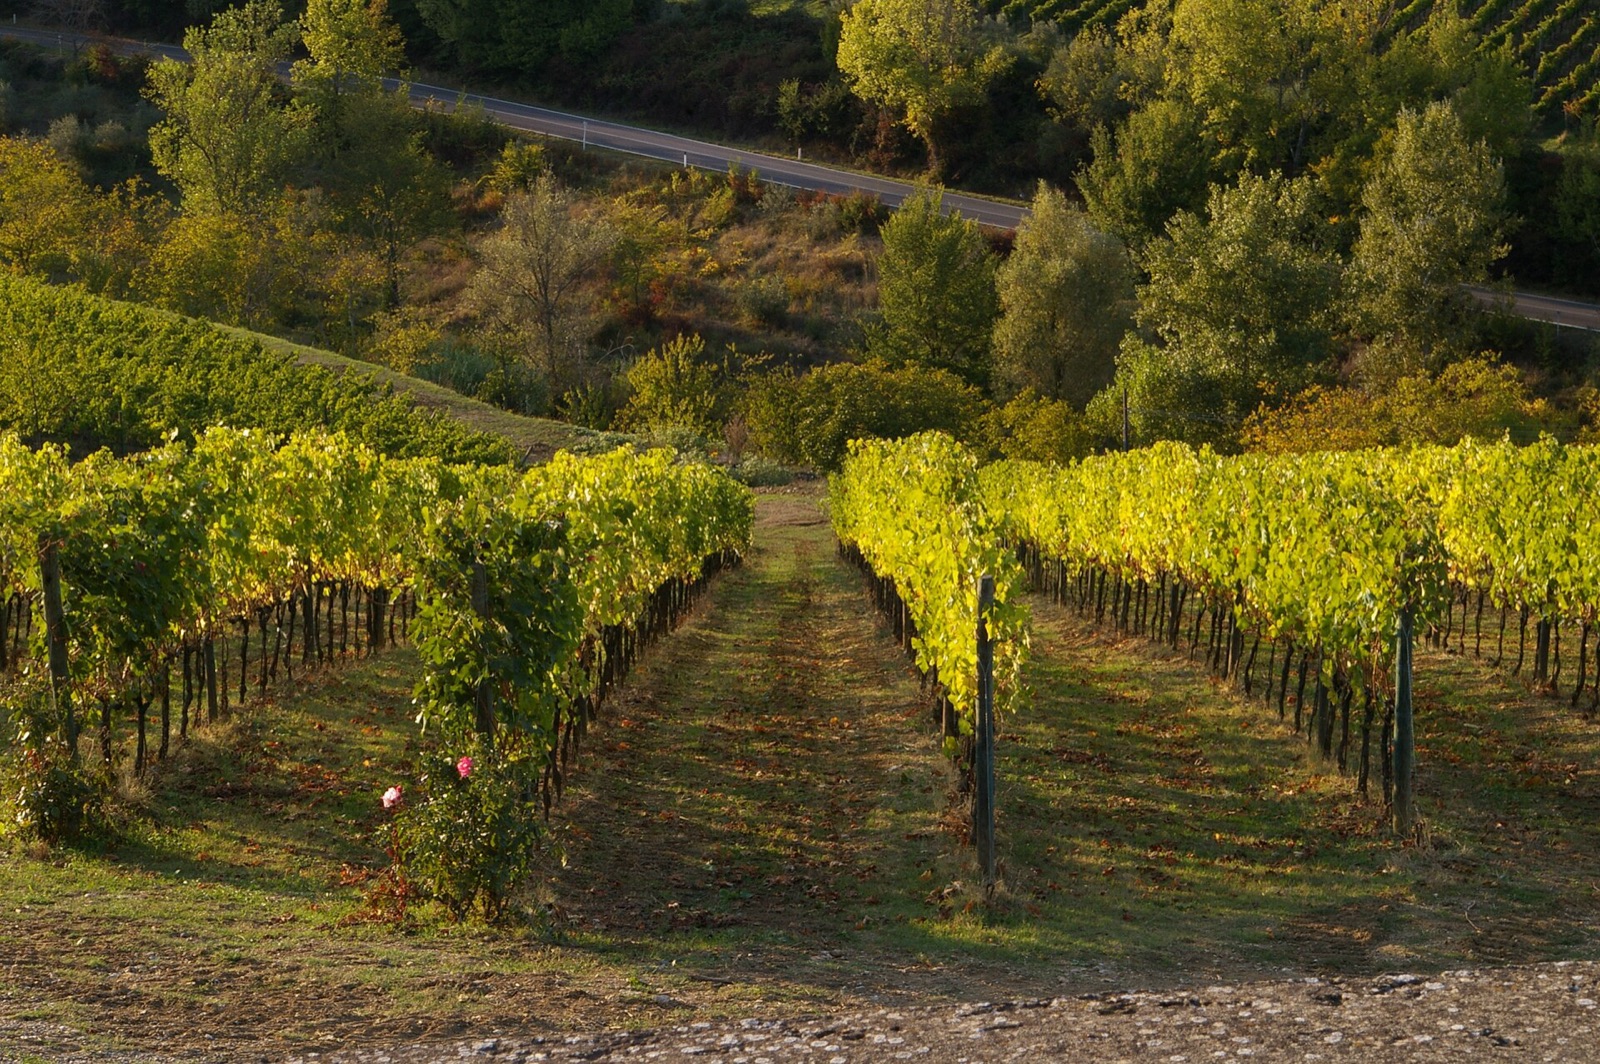
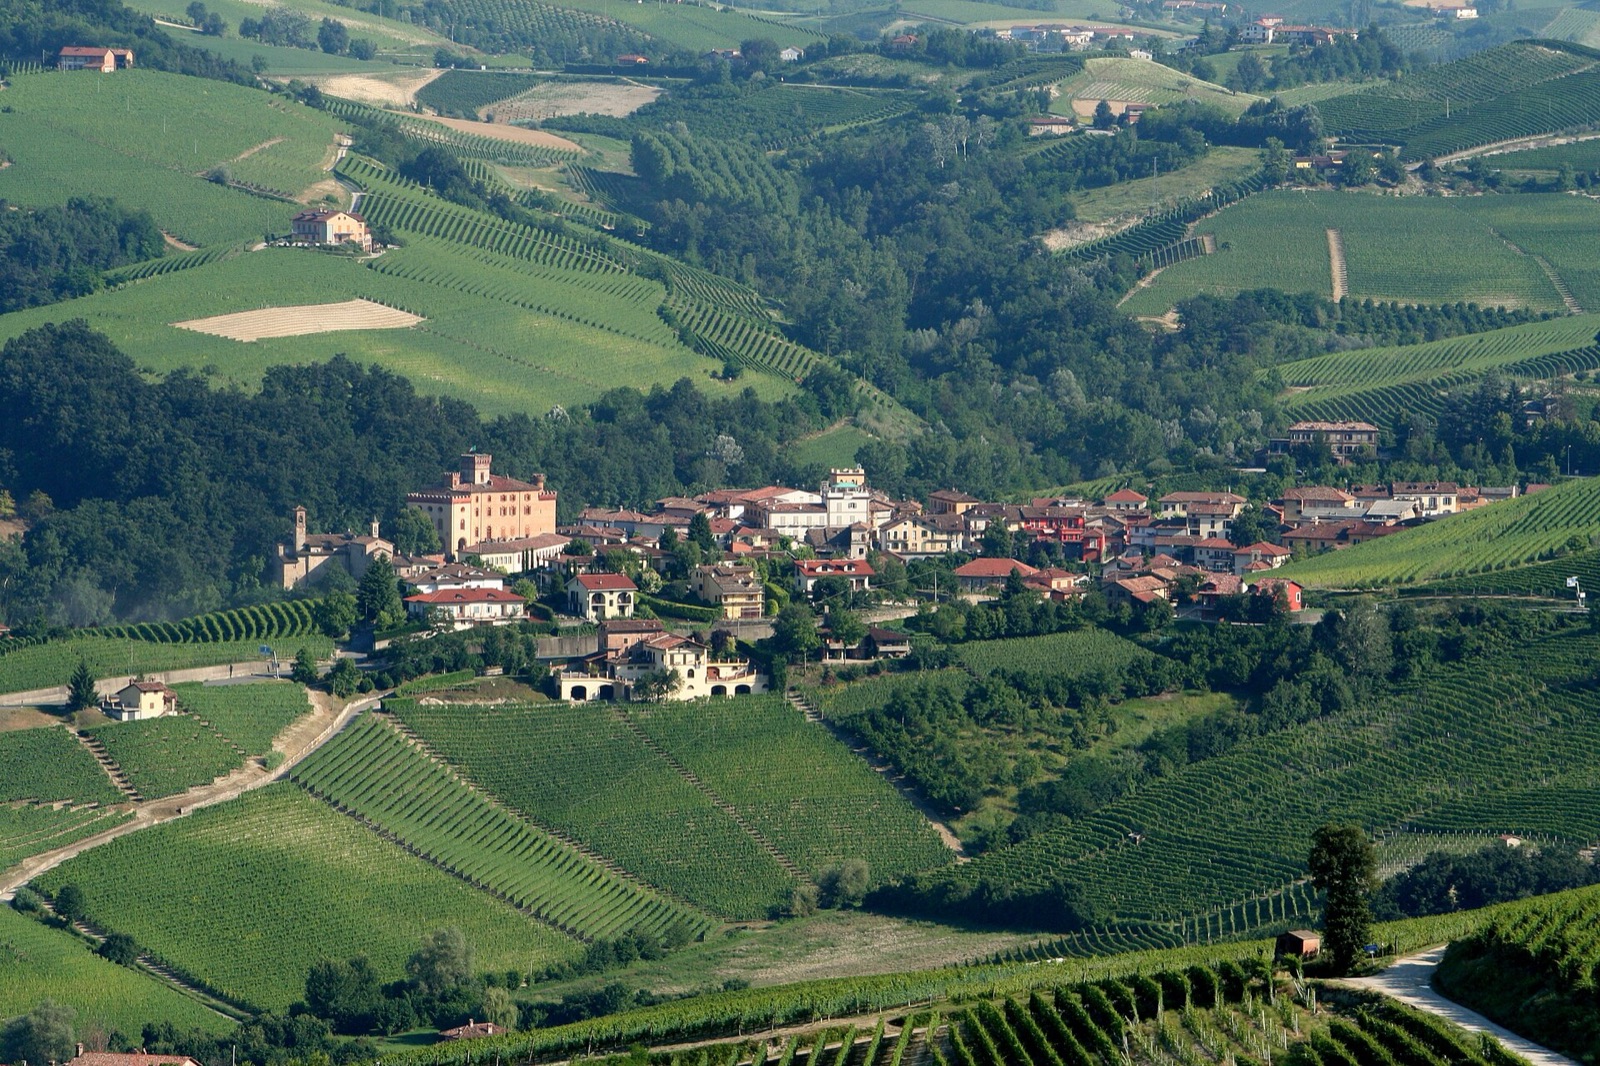
A blank square means we have no wine on file from that region in that year. Each rating covers the whole region. A single estate can do better or worse.
The story in numbers
| Region | Years rated | Share excellent or better | Exceptional years | Difficult years |
|---|---|---|---|---|
| Bordeaux | 32 | 41% | 1990, 2005, 2009, 2010, 2016, 2022 | 2013 |
| Burgundy | 29 | 34% | 2005, 2015, 2019 | 2021 |
| Champagne | 21 | 14% | 2002, 2008 | — |
| Rhône | 23 | 30% | 2010, 2015, 2016 | — |
| Napa Valley | 34 | 38% | 2013 | 2011, 2020 |
| Tuscany | 28 | 29% | 2016 | 2002 |
| Piedmont | 22 | 32% | 2010, 2016 | 2002 |
| Rioja | 6 | 67% | — | — |
| Mosel | 15 | 33% | — | — |